AWS - Cloudwatch dashboard and Configuring Monitoring services
Cloud Watch
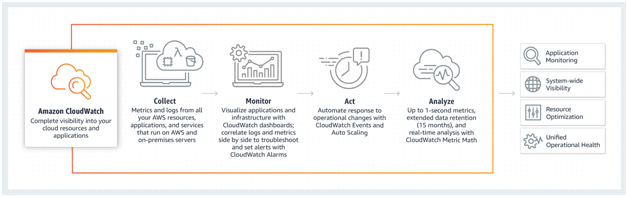
Amazon CloudWatch is a monitoring and observability service built for DevOps engineers, developers, site reliability engineers (SREs), and IT managers. CloudWatch provides you with data and actionable insights to monitor your applications, respond to system-wide performance changes, optimize resource utilization, and get a unified view of operational health. CloudWatch collects monitoring and operational data in the form of logs, metrics, and events, providing you with a unified view of AWS resources, applications, and services that run on AWS and on-premises servers. You can use CloudWatch to detect anomalous behavior in your environments, set alarms, visualize logs and metrics side by side, take automated actions, troubleshoot issues, and discover insights to keep your applications running smoothly.
Best AWS Training Institute in Gurgaon...
Amazon CloudWatch Dashboards
Amazon CloudWatch dashboards are customizable home pages in the CloudWatch console that you can use to monitor your resources in a single view, even those resources that are spread across different Regions. You can use CloudWatch dashboards to create customized views of the metrics and alarms for your AWS resources.
With dashboards, you can create the following:
● A single view for selected metrics and alarms to help you assess the health of your resources and applications across one or more regions. You can select the color used for each metric on each graph, so that you can easily track the same metric across multiple graphs.
● You can create dashboards that display graphs and other widgets from multiple AWS accounts and multiple Regions. For more information, see Cross-Account Cross-Region CloudWatch Console.
● An operational playbook that provides guidance for team members during operational events about how to respond to specific incidents.
● A common view of critical resource and application measurements that can be shared by team members for faster communication flow during operational events.
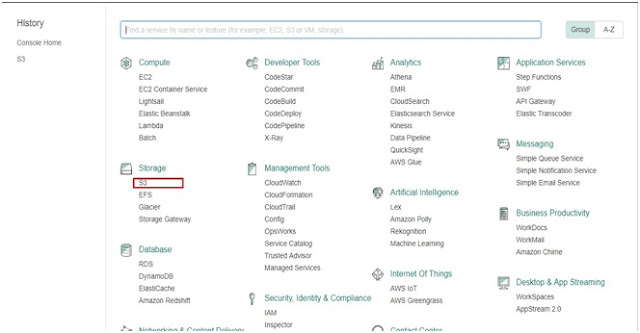
You can create dashboards by using the console, the AWS CLI, or the PutDashboard API.
To access CloudWatch dashboards, you need one of the following:
● The AdministratorAccess policy
● The CloudWatchFullAccess policy
● A custom policy that includes one or more of these specific permissions:
● cloudwatch:GetDashboard and cloudwatch:ListDashboards to be able to view dashboards
● cloudwatch:PutDashboard to be able to create or modify dashboards
● cloudwatch:DeleteDashboards to be able to delete dashboards
Configuring Monitoring services
CloudWatch collects
monitoring and operational data in the form of logs, metrics, and events, and
visualizes it using automated dashboards so you can get a unified view of your
AWS resources, applications, and services that run in AWS and on-premises. You
can correlate your metrics and logs to better understand the health and
performance of your resources. You can also create alarms based on metric value
thresholds you specify, or that can watch for anomalous metric behavior based
on machine learning algorithms. To take action quickly, you can set up
automated actions to notify you if an alarm is triggered and automatically
start auto scaling, for example, to help reduce mean-time-to-resolution. You
can also dive deep and analyze your metrics, logs, and traces, to better
understand how to improve application performance.
Get More Information About AWS Training and Certification Course Visit Here.
Thank You For Reading
Written By Amal Satheesh
Comments
Post a Comment